Plain Text Visualisation: The Emacs User Survey Results

Peter Prevos |
686 words | 4 minutes
Share this content
The Emacs User Survey was held in 2020 and 2022. It is a bit ironic that the data was neither collected nor analysed with Emacs. This article shows how to visualise the Emacs user survey results with plain text inside of Emacs. First, we download the CSV file and then parse it into an association list. With some bespoke functions and the quirky chart package that forms part of core Emacs.
Read the cleaned CSV file
Before visualising the data, let's declare some required packages and download the 2020 Emacs user survey data.
  (require 'csv)
  (require 'f)
  (require 'dash)
  (require 'chart)

  (url-copy-file
   "https://emacs-survey.netlify.app/2020/Emacs-User-Survey-2020-clean.csv"
   "emacs-survey.csv" 1)
Define some functions
The CSV package by Ulf jasper provides functionality to parse a CSV file buffer into a list of alists. Unfortunately, this package has no functionality to read CSV files or extract data, so I wrote a few additional functions. Thanks to u/deaddyfreddy for helping with wrangling association lists. I initially tried chatGPT to write some elisp code, but that was a disaster. Glad to see that human intelligence still trumps the silicon variant.
The csv-parse-file function parses a CSV file into a list of alists. The csv-extract-column-* functions extract the values from a column by number or header. The result of these functions is a simple list that can be visualised.
  (defun csv-parse-file (file)
    "Read CSV FILE and parse its contents."
    (with-temp-buffer
      (insert-file-contents file)
      (csv-parse-buffer t)))

  (defun csv-extract-column-number (n csv)
    "Extract values in column N from parsed CSV file into an alist."
    (mapcar #'cdr
            (seq-map (lambda (list) (nth (- n 1) list)) csv)))

  (defun csv-extract-column-name (name csv)
    "Extract the values in a column with NAME from parsed CSV into a list."
    (mapcar #'cdr
            (seq-map (apply-partially #'assoc name) csv)))
Visualise the Emacs User Survey Results
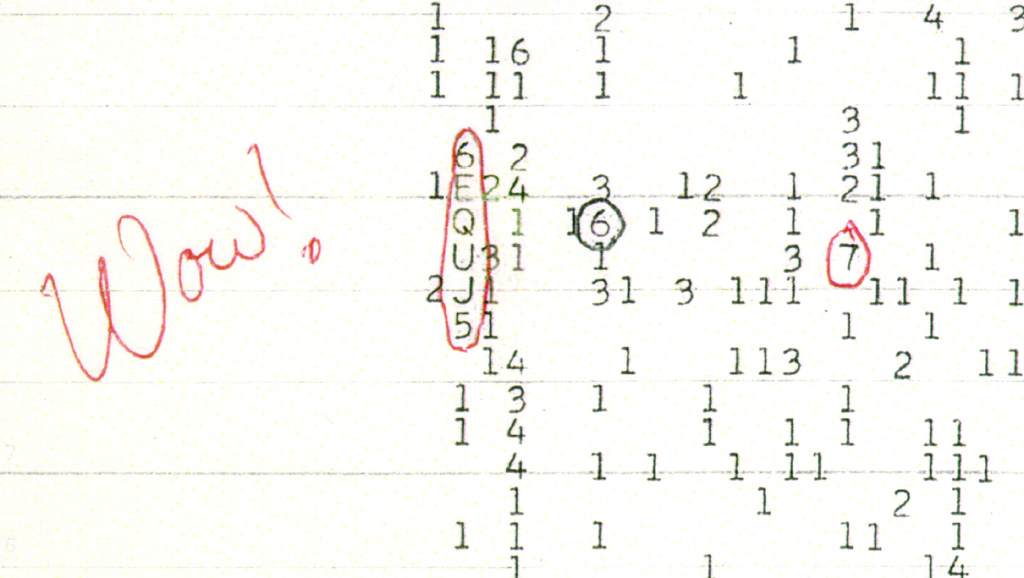
Visualising data with in plain text is a lost art. The famous WOW signal is our best candidate for a signal from an extraterrestrial civilisation. No fancy visualisations like we are used from radio astronomy, but a simple plain text data stream printed on chain paper. Computer users were creative with plain text and there is still a cult following of ASCII art, images that only use plain text characters.
We are now spoilt with graphical displays, but there are still some packages that can visualise data with plain text, including Eric Ludlam's chart package. This code can draw coloured bar charts in plain text. The chart-bar-quicky function takes several arguments, most notably the x and y variables for the chart. The n variable declares the number of bars to draw. We need some more helper functions to visualise the CSV data.
We want the bar height to count each unique item, so we also need a function to create a ordered frequency table. The visualose-frequency-table mashes everything together to create a bar chart.
  (defun create-frequency-table (data)
    "Generate an ordered frequency table from DATA."
    (sort (-frequencies data)
          (lambda (a b) (> (cdr a) (cdr b)))))

  (defun visualise-frequency-table (table n var title)
    "Create a bar chart from a frequency TABLE with top N entries.
  VAR and TITLE used for display."
    (chart-bar-quickie
     'horizontal
     title
     (mapcar #'car table) var
     (mapcar #'cdr table) "Frequency" n))
Now we are ready to visualise the data. Parsing the data can take a few moments as it contains thousands of results. The bar chart will pop up in a new buffer.
  (setq emacs-survey
        (csv-parse-file "emacs-survey.csv"))

  (visualise-frequency-table
   (create-frequency-table
    (csv-extract-column-number 6 emacs-survey))
   10
   "Responses"
   "Which version of Emacs do you primarily use?")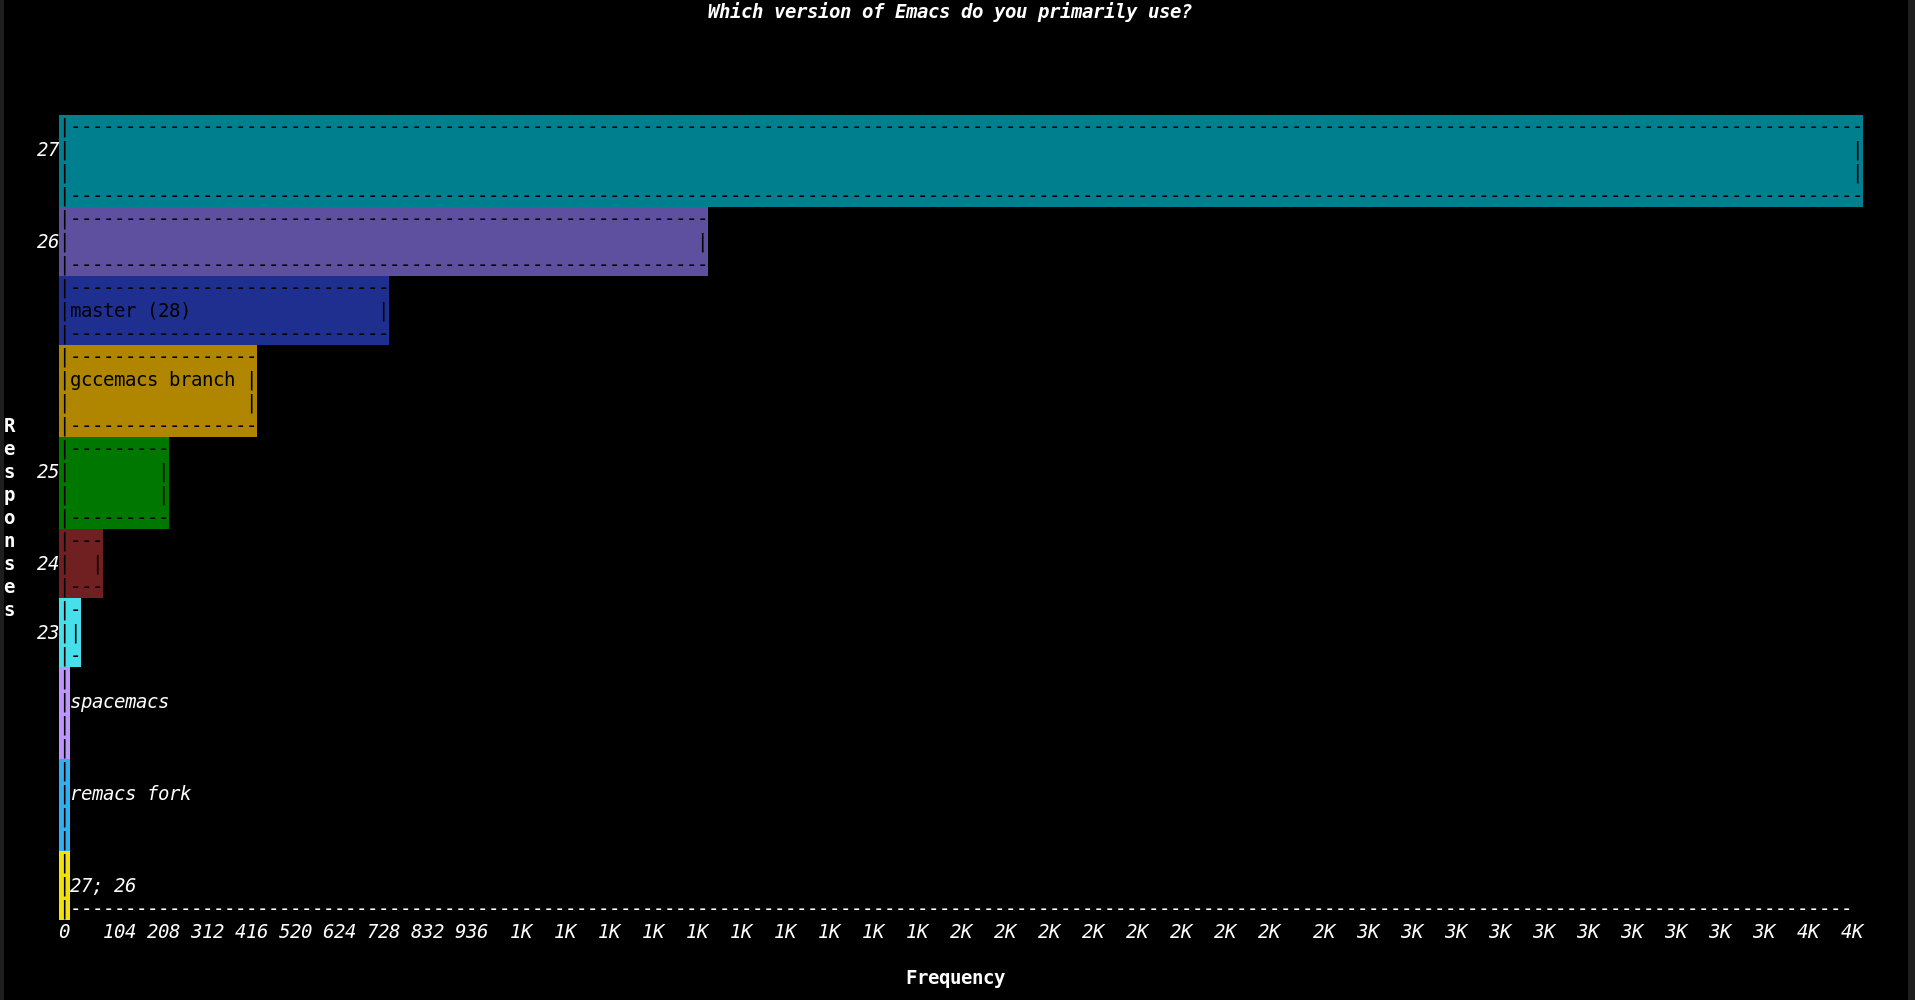
Conclusion
Visualising data with plain text is less aesthetic than using graphics, but it does the job of telling the story, which is the purpose of visualisation. There are other methods to create graphics inside an Emacs buffer. For example, one could use a literate programming approach and write an Org Mode file and run R, Python, MATLAB or GNUPLot code to create graphics. The latter also has an option to create graphics in plain text.
Let's hope the following Emacs user survey will be more Emacs-centric in its's data collection and presenting the results.
Share this content
