Working with Dates and Times in R

Peter Prevos |
466 words | 3 minutes
Share this content
Most data collected in operational processes are time series. These are data sets where each measurement is associated with the time of the measurement or observation. This chapter introduces a study which looks at synthetic data collected from water meters from individual houses. Meter reads collected at a high frequency provide valuable insights into water consumption, such as leak detection. This chapter of Data Science for Water Utilities explains how the R language manages dates and times and uses this knowledge to explore time series data. The learning objectives for this chapter are:
- Understand the principles of how the R language processes date and time variables.
- Apply the functionality of the Lubridate package to manipulate dates and times.
- Use date and time variables in calculations and visualisations.

Data Science for Water Utilities
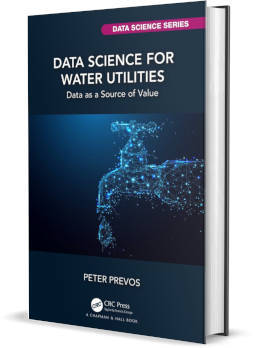
Data Science for Water Utilities published by CRC Press is an applied, practical guide that shows water professionals how to use data science to solve urban water management problems using the R language for statistical computing.
The data and code used in this chapter are available on GitHub:
Date and Time Variables
All date and time variables in R use integer numbers starting at the Unix Epoch (1 January 1970). Spreadsheets tend to use 31 December 1899 as their datum.
The basic time string uses the ISO 8601 convention, i.e. "2023-06-15 18:23:45 AEST".
Lubridate Package
Working with dates and times in base R can be challenging. The lubridate package in the Tidyverse lubricates dates and times with some convenient functions.
Digital Metering Leak Detection
The case study for this chapter uses synthetic digital metering data. The data for this case study was simulated using R scripts.
The article on analysing digital metering data explains some of the principles and creates a diurnal curve.

Working with Dates and Times in R Screencast
Additional Resources
Addendum
The code on page 150 uses the summarise() function to calculate daily flows. This function has been deprecated for this particular case. While summarise() requires that each argument returns a single value, and mutate() requires that each argument returns the same number of rows as the input, reframe() is a more general workhorse with no requirements on the number of rows returned per group.
Other Chapters
Previous Chapter: Clustering Customers to Define Segments
Next Chapter: Detecting Anomalies and Outliers in Water Data.
Feel free to contact me if you have any comments, suggestions or questions about this book.
Share this content


