Trumpworld Analysis: Ownership Relations in his Business Network

Peter Prevos |
529 words | 3 minutes
Share this content
You do not need a machine learning algorithm to predict that the presidency of Donald Trump will be controversial. Judging by his pointed language in the campaign, we can rest assured that Trump will break many conventions of world politics. One of the most discussed aspects of his reign is the massive potential for conflicts of interest. Trump's complex business empire is entangled with national and international politics. Buzzfeed has mapped many of the relationships between businesses and people in what they have dubbed Trumpworld.
They provided the data to enable citizens data science into the wheeling and dealings of Donald J. Trump. The raw data set consists of three subsets of connections between:
- Organisations
- People
- People and organisations
This article presents a quick analysis of the data using the R language for statistical computing and the iGraph package for analysing networks.
Trumpworld Analysis
This article analyses the connections between organisations using the mighty igraph package.The package implements social network analysis for the R language which can be used for many purposes, such as analysing email traffic or flight paths.
The code snippet below reads the data and converts it to a graph that can be examined using social network analysis techniques. I have saved the raw data available on Google Sheets file as CSV files. This data is filtered to contain only ownership relationships and the names of the organisations.
  ## Analysing Trumpworld
  library(tidyverse)
  library(igraph)
  trumpworld.org <- read_csv("trumpworld/TrumpWorld Data org-org.csv") %>%
      filter(Connection == "Ownership") %>%
      select(OrgA = "Organization A", OrgB = "Organization B")

  org.ownership <- trumpworld.org %>%
      as.matrix %>%
      graph.edgelist()

  par(mar=rep(0,4))
  plot(org.ownership,
  layout = layout.fruchterman.reingold,
      vertex.label = NA,
      vertex.size = 2,
      edge.arrow.size = .1
  )
Network Analysis
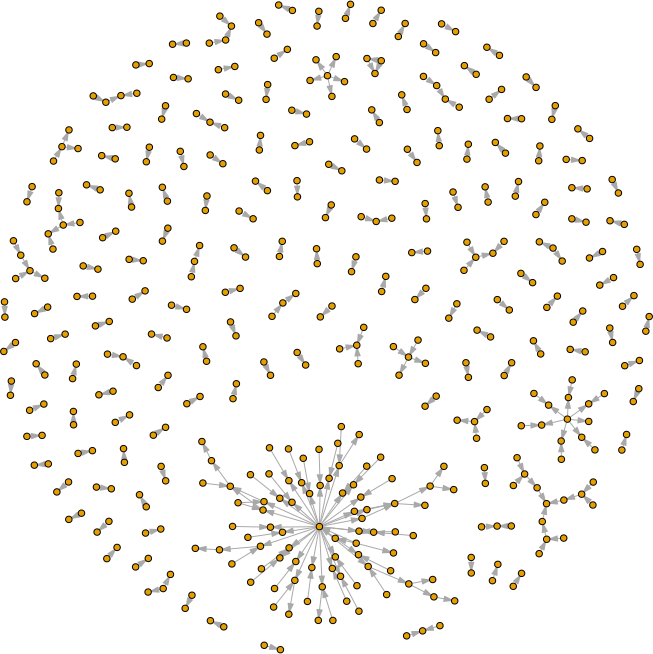
This network contains 309 ownership relationships between 322 distinct organisations. When we plot the data, we see that most connections are dyadic connections between two firms. The plot is organised with the Fruchterman-Reingold algorithm to improve its clarity. We can also see a large cluster in the centre. The names have been removed for clarity. Our excursion into Trumpland continues by zooming in on the subnetwork. The second code section excises this connected subnetwork so we can analyse it in more detail.
Digging Deeper
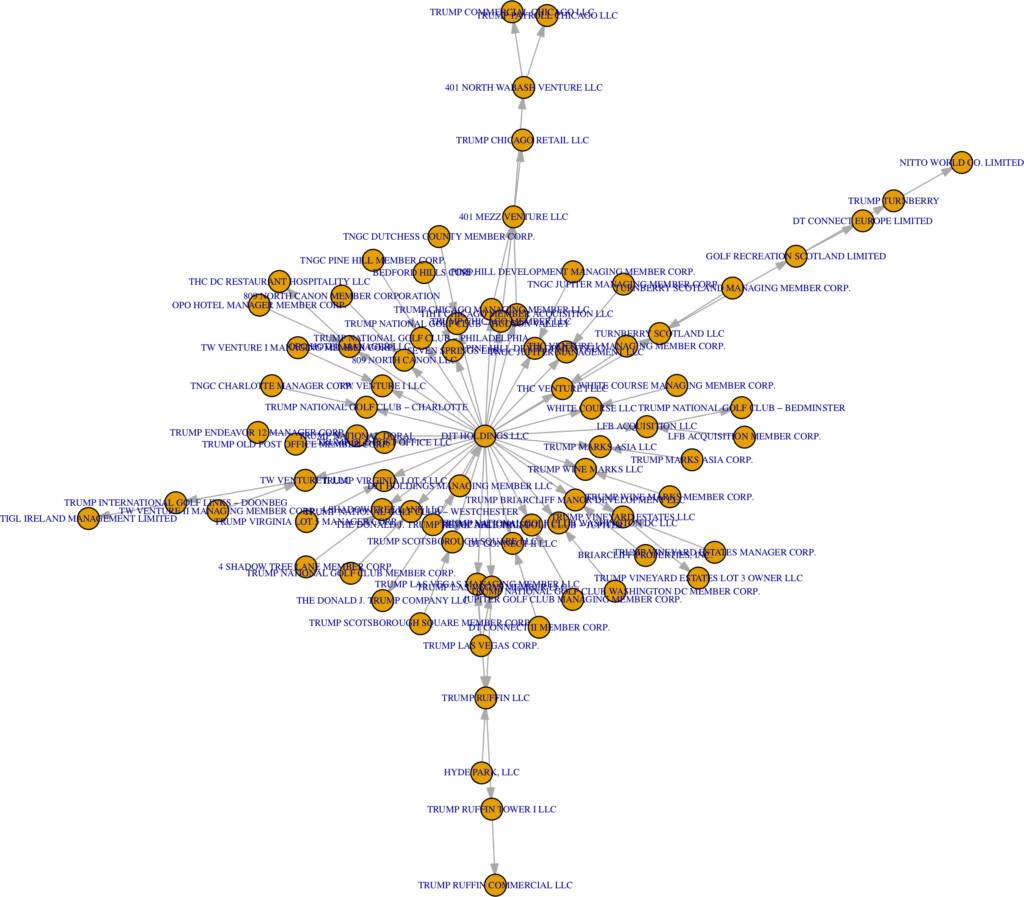
The node with the highest degree identifies the business with the most holdings. This analysis shows that DJT Holdings LLC owns 33 other organisations. These organisations hold other organisations. We can now use the cluster function to investigate this subnetwork using the decompose function, which splits the network into its unconnected subnetworks. The code then selects and visualises the largest of the subnetworks.
This Trumpworld analysis shows that the ownership network is a star network. DJT Holdings LLC centrally controls all organisations. Perhaps this graph visualises the management style of the soon to be president Trump. Trump centrally controls his empire, which is typical of a family business. Does this chart visualise Trump's leadership style? Is the star network an expression of his lack of trust and thus desire to oversee everything directly?
  which.max(degree(org.ownership))

  org.ownership.d <- decompose(org.ownership)

  largest <- which.max(sapply(org.ownership.d, diameter))

  plot(org.ownership.d[[largest]],
       layout=layout.fruchterman.reingold,
       vertex.label.cex = .5,
       vertex.size = 5,
      edge.arrow.size = .1
  )
Share this content


