Sharing the Results of Data Analysis with R Markdown

Peter Prevos |
653 words | 4 minutes
Share this content
Data science aims to create value from data by creating useful, sound and aesthetic data products. Analysing data is rewarding, but creating value requires you to communicate the results. Analysing data in RStudio is fun but hard to share with anyone who does not understand the language. Of course, you could copy and paste results into a document, but that is neither efficient nor reproducible. This chapter explains how to communicate the fruits of your labour with colleagues and other interested parties by generating reports that combine text and analysis through literate programming. This chapter of Data Science for Water Utilities a workflow for data science products and how to create data products using the R Markdown method. The learning objectives for this chapter are:
- Implement the workflow for data science projects
- Apply the principles of reproducible and replicable research
- Use basic R Markdown to create a Powerpoint presentation from data

Data Science for Water Utilities
Data Science for Water Utilities published by CRC Press is an applied, practical guide that shows water professionals how to use data science to solve urban water management problems using the R language for statistical computing.
The data and code used in this chapter are available on GitHub:
Data Science Workflow
The data science workflow starts with preparation and data cleaning, which can take most of the time in some projects. All projects should begin with a concise problem statement to prevent open-ended data dredging. Programmatic data cleaning is the topic of the next chapter.
Once the data has been tidied, we can try to understand the data through exploratory analysis using descriptive statistics and visualisation. That insight allows us to model and reflect, an iterative process known as the 'data vortex'.
Once we have created the model that best answers the problem statement, we can communicate these results to the consumers of our data products. One method is through literate programming with tools such as R Markdown or Org Mode.

Literate Programming Reproducible Analysis
Literate programming means integrating the text, the data and the code. This approach ensures that the analysis is reproducible, which means you can repeat the same process with new data in the same way.
A data science project consists of at least three sets of code:
- Cleaning code to get from raw data to a tidy state
- Analytical code to analyse the data
- Presentation code to create summaries, tables and figures.

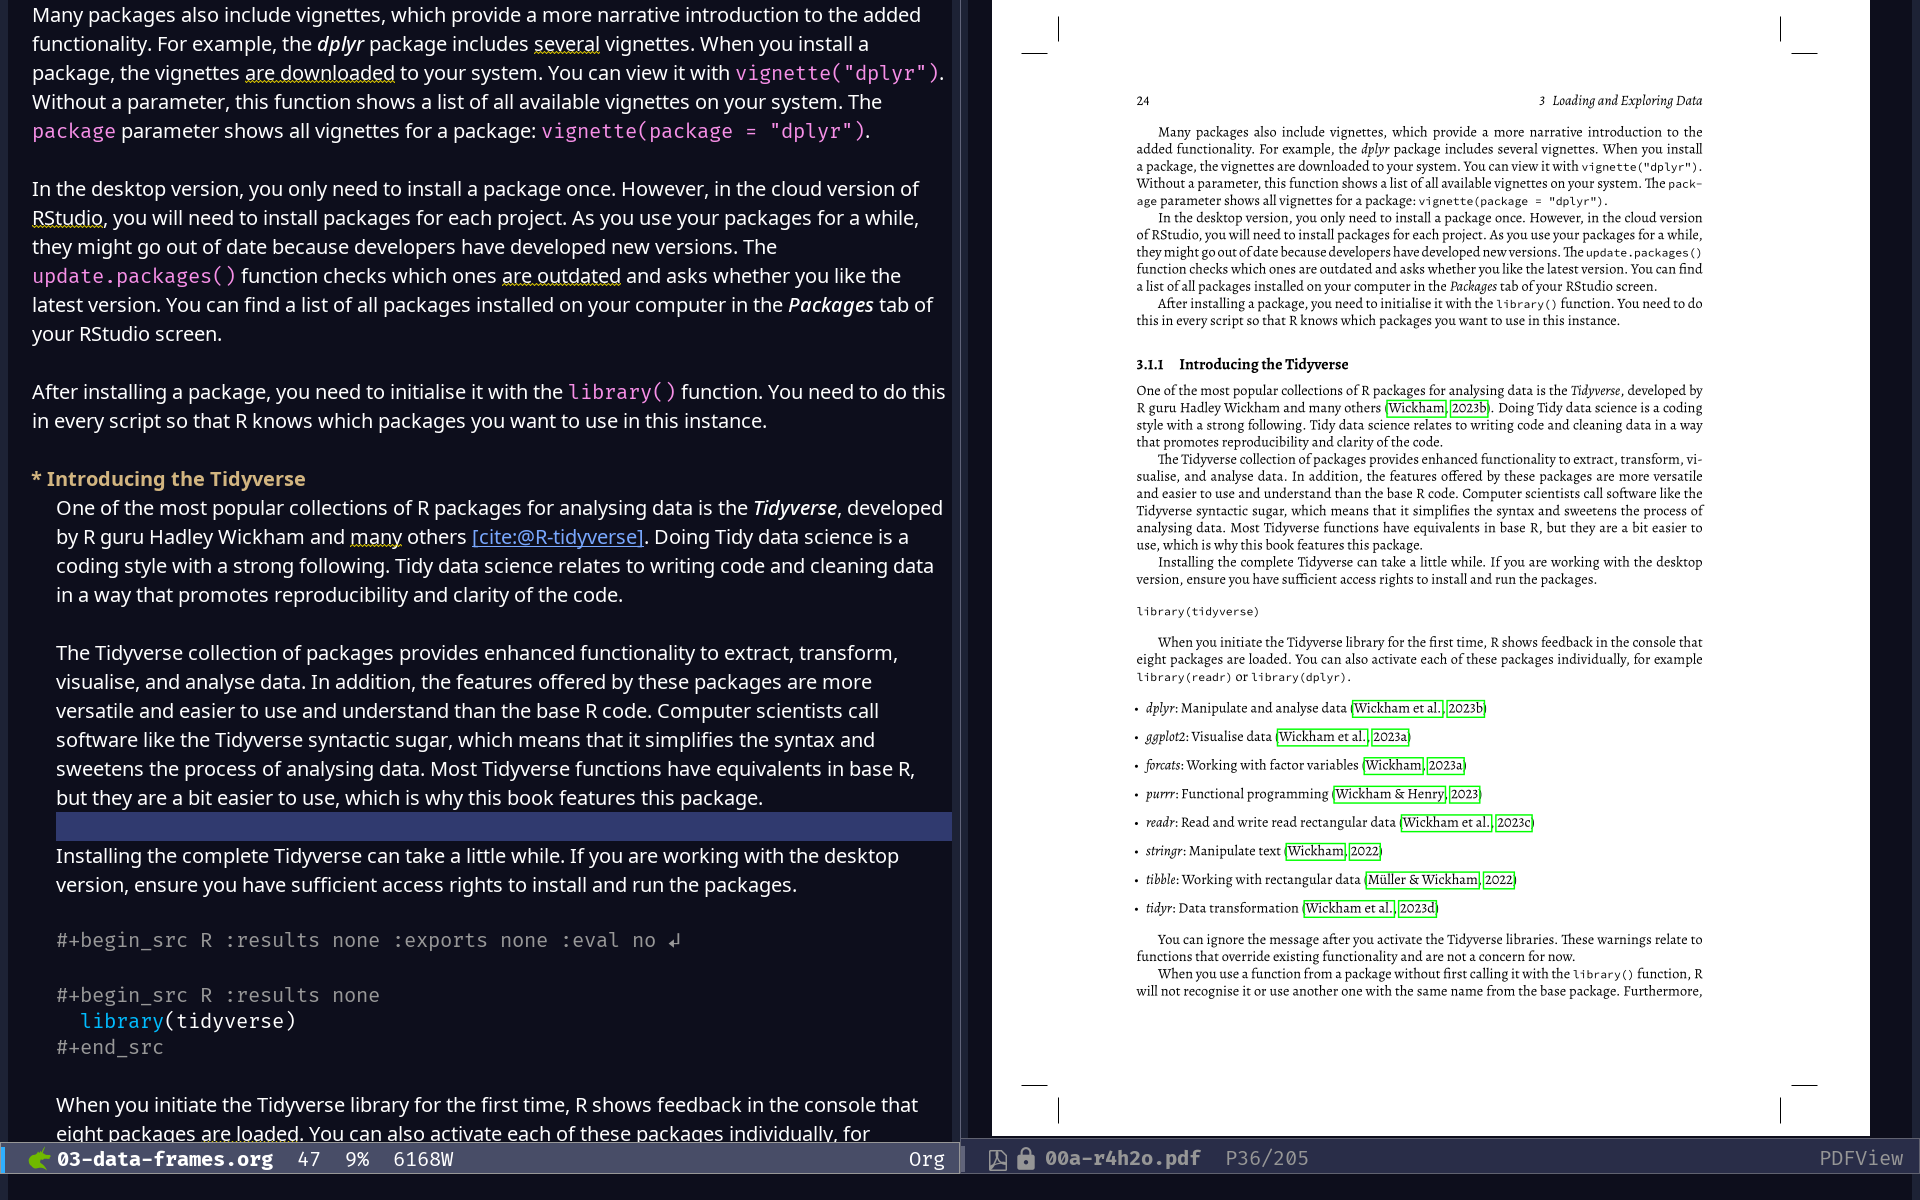
With literate programming, you can combine text and code in one script. The most popular method with R is to use a Markdown file. This is the WYSIWYM (What You See is What You Mean) approach instead of the more popular WYSIWYG (What You See Is What You Get) approach in word processors.

The left part of the screen shows what it looks like when I write a book, and the right part shows the end result when exported as a PDF file.
The screencast below introduces the principles of this approach.
Sharing the Results of Data Analysis Screencast
Additional Resources
The consumer-involvement.Rmd in the case-studies folder of the GitHub repository shows how to write a journal article, including references using a BibTeX file. The concept of Consumer Involvement is explained in Chapter 8.
The R Markdown: The Definitive Guide by Yihui Xie and others explains the how to use literate programming in R in great detail.
Other Chapters
Previous Chapter: Visualising Data with ggplot2
Next Chapter: Managing Dirty Data
Feel free to contact me if you have any comments, suggestions or questions about this book.
Share this content


