A Brief Guide to Providing Insights as a Service

Peter Prevos |
1988 words | 10 minutes
Share this content
Analysing data requires a high level of technical skill, which Drew Conway summarised in his often-cited Venn diagram. Following this model, data scientists, individually or as a team, require competencies in computer science, statistics, and knowledge of the domain they are analysing. There is, however, more to providing value from data than these three technical skills. This article introduces the concept of Insights as a Service (IaaS), a framework to assist data science teams with maximising the value they deliver to their internal or external customers.
With the ongoing improvement of AI capabilities, the technical skills of data professionals are becoming increasingly automated. This development requires data engineers, analysts, and scientists to embrace the elusive softer skills and use insights from marketing and the humanities. The insights as a Service Framework enables data professionals to plan and execute their projects, creating greater value for their clients.
This model incorporates lessons I learned while managing a data team for over ten years, as well as my research into applying Service-Dominant Logic.
The content of this article was recently discussed in the Value Driven Data Science podcast by Genevieve Hayes.
Introducing the Insights as a Service Framework
Technology managers regularly apply the acronym "PPT" (People, Process, and Technology) as a mnemonic. The golden triangle of technology management dates back to the early 1960s when Harold Leavitt developed his Diamond Model. Bruce Schneier modified and popularised the tool in the 1990s.
From a service delivery perspective, we need to add some more dimensions. The Services Marketing Mix, first developed by Bernard Booms and Mary Bitner in 1981, employs seven dimensions as a model for delivering services. A marketing mix is not a model that guarantees success. You need to use it as a heuristic device to think more deeply about the service your team provides.
These two models conceptually overlap, which leads to the IaaS framework. Insights as a Service recognises the importance of the core elements of PPT and adds elements from the services marketing mix. This combination leads to six dimensions: Product, Price, Promotion, People, Process, and Platform (technology is renamed for a lovely alliteration of six Ps).
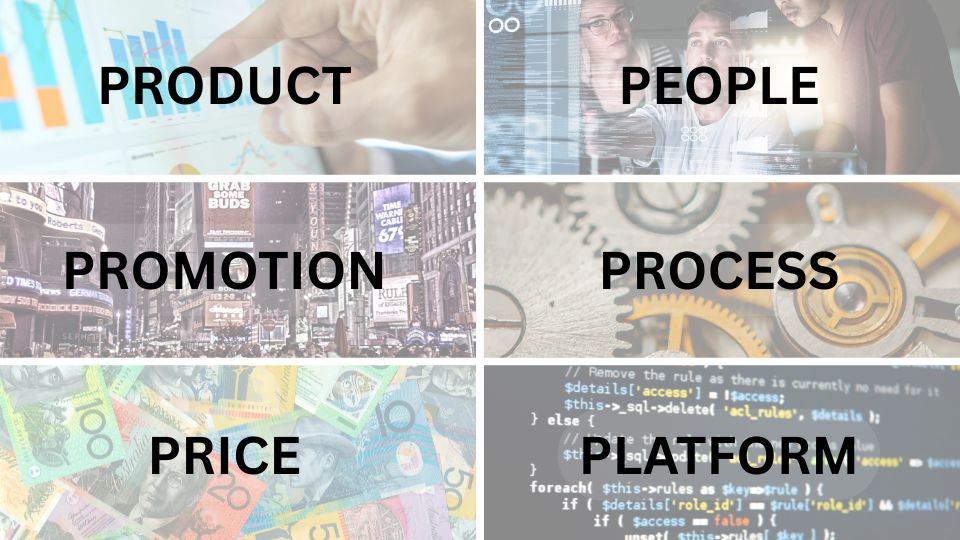
Insights as a Service (IaaS) is in most cases used exclusively in a B2B (Business-to-Business) context. In this scenario a commercial service provider generates insights for a client using a cloud-based platform. This article reinterprets the IaaS model to include contexts where an internal data team provides electronic services to colleges (B2E, Business-to-Employee).
The Insights as a Service Framework
The remainder of this article briefly discusses the significance of each of these framework dimensions and their practical relevance.
Product
The data product, which is, in most cases, a report, either static or interactive, is the vehicle that delivers value to the end-user. We can use an analogy from architecture by following the Vitruvian rules for buildings and translating them to our context:
- Sound: Is the analysis mathematically and statistically correct?
- Useful: Can the client generate insights from it?
- Aesthetic: Is the data product well-designed and, as such, easy to understand?
This previous article about strategic data science discusses this model of good data science in more depth, which is also explained in detail in my book on the topic.

Principles of Strategic Data Science
Principles of Strategic Data Science helps you join the dots between mathematics, programming, and business analysis. With a unique approach that bridges the gap between mathematics and computer science, this book takes you through the entire data science pipeline.
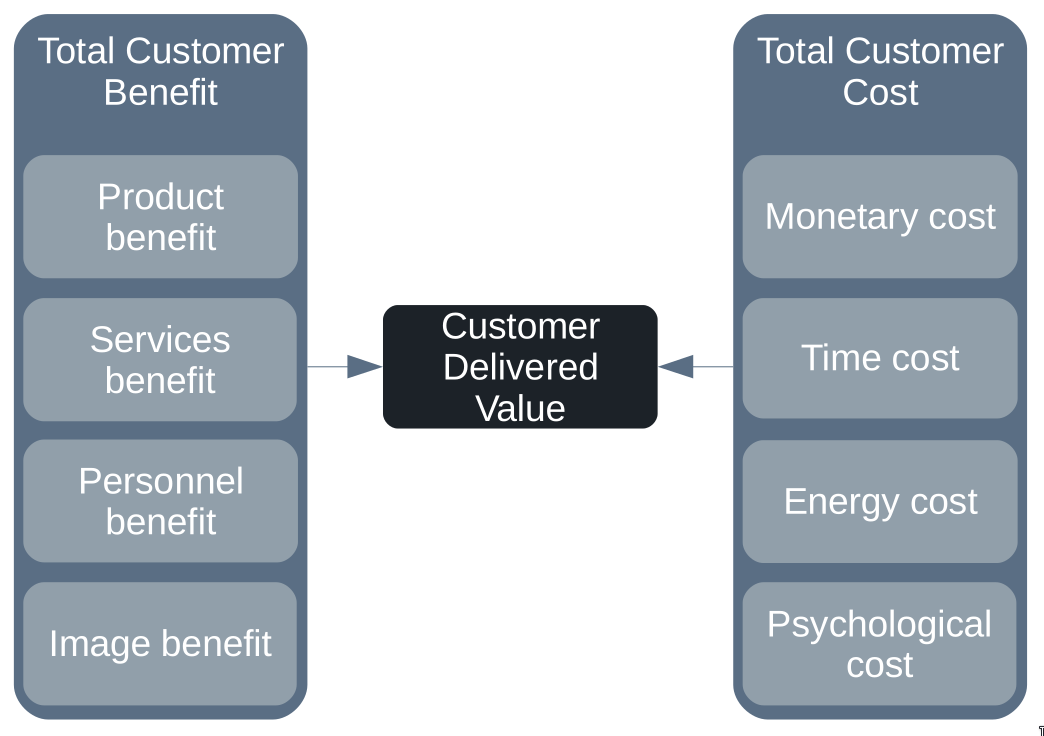
The value of a service product, in simplest terms, is the difference between the benefits and the cost. The product provides the benefits of the value equation, visualised below. While the product delivers value to the customer, there is also a cost, which is the next dimension in the framework.
Price
Whether you are an internal data science team or a commercial service provider that assists other organisations with creating value from data, all development has a price. However, the monetary cost of a data product is only one dimension of the total Price equation.
Firstly, consumers of services incur a time cost. The time cost of a service is the amount of time a consumer (in our case, the user of a data product) spends using the tool. The time we spend using a service is an opportunity cost because we could be doing something else.
The time cost also extends to the development phase as the input from end users is essential. A data professional relies on the detailed, contextual knowledge of the end-user to create insights.
An extension of the time cost to use a service is the mental cost. How much mental effort does an end-user need to use to understand the output of your data product? The cognitive cost of consuming insights can be minimised in two ways. Firstly, the design of the report needs to be aesthetic. Not in the sense of beatification, but in making the end product easy to understand.
The mental cost to users of a report depends a lot on their data literacy. The advanced specialisation of data science has created a knowledge gap between subject-matter experts who use the report and the advanced statistical methods used by analysts. Reducing this knowledge gap requires the service provider to educate their customers, which falls under the next dimension of the IaaS framework.
Promotion
When working in a B2B environment, the necessity for promotion is easily understood. However, promotion is also essential for internal teams working in B2E.
A data science service provider is often invisible to the consumer of its services. Being invisible is a good thing because it means our data products are working flawlessly, but this great uptime also comes at a cost, as your services might be taken for granted. The most effective way to combat invisibility is promotion.
For teams providing services to external entities (B2B), promotion is an essential business activity. However, this also applies to internal data teams. In my workplace, we ensure that our colleagues have regular visibility of the tools we develop through intranet articles and other internal communication means. These promotional activities ensure that management understands the relevance of the team and improves data literacy across the organisation.
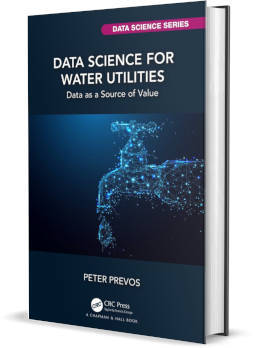
To promote data science skills in my industry, I wrote a textbook for water professionals who want to move away from their spreadsheets, the content of which I also deliver as a course. One objective of this course is to equip water professionals with the skills to communicate effectively with data scientists. Increasing data literacy among those who work with data scientists is essential to ensure the full value of our services is realised.
Data Science for Water Utilities
Data Science for Water Utilities published by CRC Press is an applied, practical guide that shows water professionals how to use data science to solve urban water management problems using the R language for statistical computing.
Another important aspect of providing valuable data services is that your client knows the team. Don't hide your experts behind the veil of technology. This thought segways nicely onto the next dimension of the framework.
People
Enough has been said and written about the technical requirements of being a data scientist. The Conway Venn diagram is a widely cited model of the technical skills required for data science. In this model, a data scientist is somebody who understands the subject matter under consideration in mathematical terms and writes computer code to solve problems.
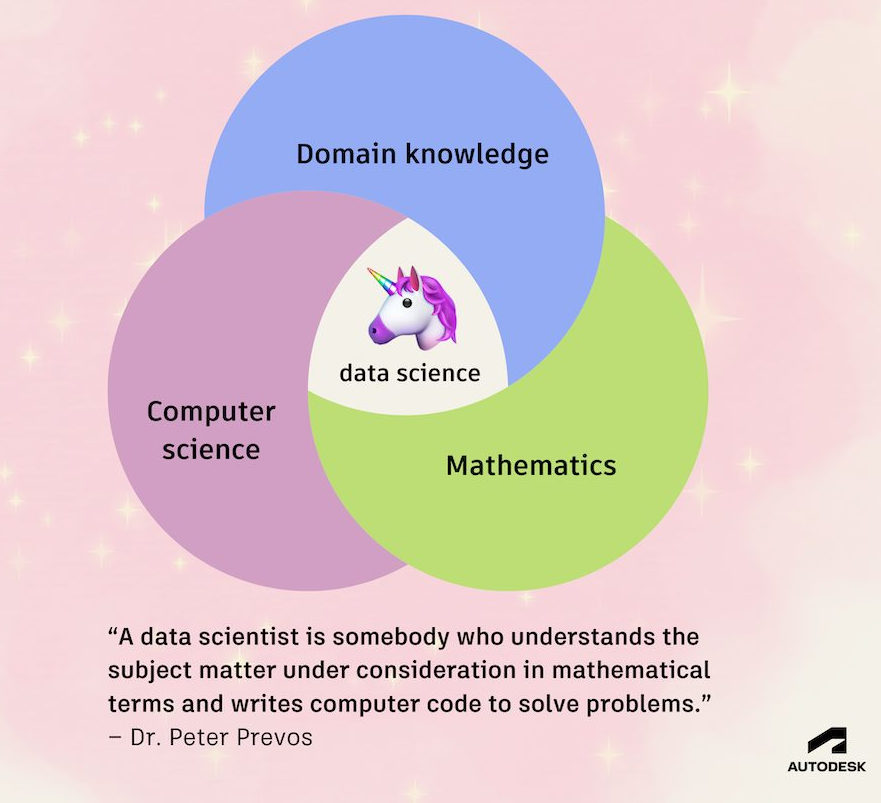
Many alternatives have been proposed that incorporate soft skills into this diagram, and the Insights as a Service Framework also does so. Especially with the steady advancement of AI developments, non-technical skills will become increasingly crucial for a data scientist to thrive in this industry.
The importance of domain knowledge cannot be underestimated. The time price of a service suggests that the client needs to invest time in explaining the context of the data problem to the developer. However, the development team also needs to have sufficient domain knowledge to advise the client. I have been in many situations where an end-user knows what problem to solve but is unable to articulate what they want clearly. It is then the task of the service provider to understand their customer and provide them with what they need.
The well-worn "faster horses" marketing cliché also applies to providing Insights as a service. A data service provider needs to be able to provide the client with a vision (in this analogy, a car) that solves or prevents problems.
Process
The process of service delivery relates to your pipeline from ideation to production. Each organisation will have a governance model to decide which projects are executed and how they are implemented.
From a service perspective, your process needs to be seamless and easy to understand while also minimising the time the client has to invest in development and testing. Service Blueprinting is a commonly used technique to map a service. The primary difference between this approach and standard process maps is that a service blueprint also considers the customer's perspective. A good service blueprint adds equal weight to the inputs of both the service provider and the service beneficiary.
Another important consideration in the service provision process is the method for measuring service quality. Service Quality goes beyond customer satisfaction and seeks to provide deep insight into which aspects of a service need improving. At a basic level, it consists of four dimensions:
- Reliability: The ability to provide the service(s) accurately and dependably.
- Assurance: The ability to project trust and confidence.
- Tangibles: The physical or digital proof of the service provider's status.
- Empathy: The ability to provide empathetic attention to customers.
- Responsiveness: The ability to provide timely services.
Platform
Last but not least is the technology platform that you use for developing the data product. Data scientists use a complex web of applications to transform raw data into the final product. The data consumption platform is the interface between this technology stack and the end-user.
When choosing a data consumption platform, two factors are essential to consider: complexity and degrees of freedom.
Firstly, complexity relates to the level of coding required to create data products, ranging from no-code to high-code. No-code means that everything can be done with a mouse and a few keystrokes. High code implies that the developer needs to use scripting languages. For example, the R Shiny platform provides interactive web applications using R and Python. This package is a high-code solution that requires a substantial amount of training to utilise effectively. KNIME is a no-code solution with a node-based graphical interface to build analytical
The less coding is involved, the more democratised access to the tool is, as more people can use it. A no or low-code platform can provide a self-service interface for subject-matter experts to analyse data without needing data science skills. Low-code platforms, such as spreadsheets also have disadvantages, most importantly that they are often not reproducible and hard to reverse-engineer when updates are required.
The second dimension is the degree of freedom available to the end user. Tools such as Power BI offer a high degree of freedom, whereas a report in MS Word provides little to no freedom for the user. While Power BI or Tableau provide a 'create-your-own-adventure' interface, other systems are more limited and provide
The choice of platform should align with the end-user's needs. A no-code solution with a high level of freedom is not always best.
Conclusion
This article summarises the Insights-as-a-Service Framework. I am currently working on a book on the topic that will dive much deeper into the model, including practical examples.
Follow or connect with me on LinkedIn if you'd like to stay informed about my progress and learn how this concept develops.
Share this content