Mapping and Geocoding with ggmap and the Google API

Peter Prevos |
460 words | 3 minutes
Share this content
In the old days, obtaining latitude and longitude required a physical survey and lots of mathematics. Google Maps has made this task much easier. This article describes how to use the Google Maps API with the ggmap library. Geocoding with ggmap is a convenient way to create meaningful spatial visualisations.
The ggmap package
Several R libraries exist to visualise spatial information. ggmap by David Kahle which aligns with the ggplot philosophy of layered visualisations.
The geocode function from the ggmap package extracts longitude and latitude from Google maps, based on a location query. The example below shows the result of a simple geocoding call for the White House and Uluru. The geocode function essentially constructs a URL to obtain the data. However, when you run this code you see an error:
  library(ggmap)
  geocode(c("White House", "Uluru"))

  Error: Google now requires an API key.
         See ?register_google for details.
In the middle of 2018, Google tightened access to the database, which means you need to register an API for it to work. This article explains how to use the latest version of ggmap and a Google account to continue using this function.
The Google API
Before we can start geocoding, we need to obtain an API key from Google. Go to the registration page, and follow the instructions (select all mapping options). The geocoding API is a free service, but you nevertheless need to associate a credit card with the account. Please note that the Google Maps API is not a free service. There is a free allowance of 40,000 calls to the geocoding API per month, and beyond that calls are $0.005 each.
Geocoding with ggmap
You will need to ensure that you have the latest version of ggmap installed on your system. The current version on CRAN is 3.0.
The code snippet below shows a minimum-working-example of how you can map coordinates using ggplot. The register_google function stores the API key. I have stored the key itself in a private text file. The getOption("ggmap") function summarises the Google credentials to check how you are connected.
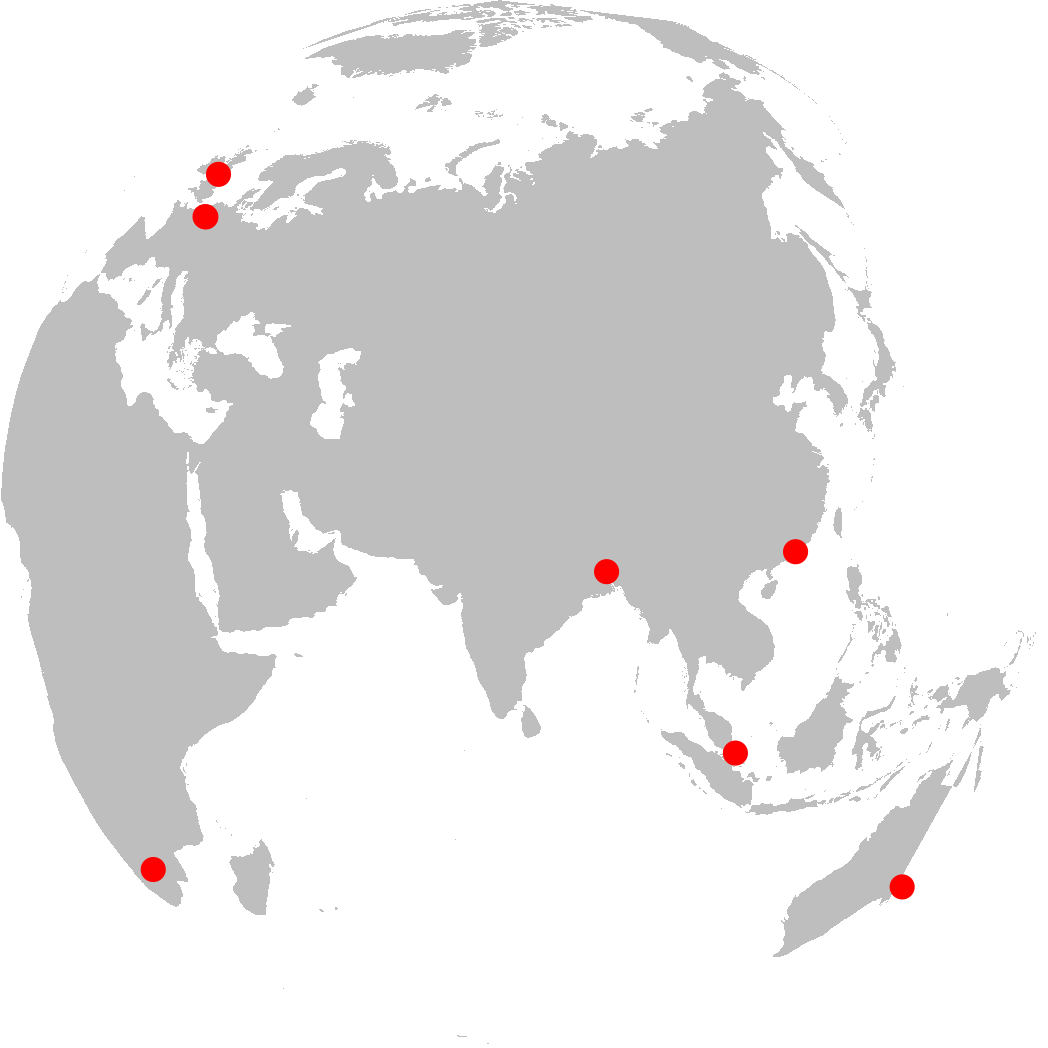
The geocode function converts the request into a URL and captures the output into a data frame. The plot shows the places I have lived, projected orthogonally on the globe. The mapproj library provides the orthogonal projection.
api <- readLines("google.api") # Text file with the API key
register_google(key = api)
getOption("ggmap")

locations <- c("Hoensbroek", "Johannesburg", "Barrow-in-Furness",
               "Hong Kong", "Singapore", "Tangail", "Maastricht", "Bendigo") %>%
     geocode()

library(ggplot2)
library(mapproj)

world <- map_data("world")
ggplot() +
     geom_polygon(data = world,  aes(long, lat, group = group),
                  fill = "grey") +
     geom_point(data = locations, aes(lon, lat),
                colour = "red", size = 5) +
     coord_map("ortho", orientation = c(30, 80, 0)) +
theme_void()Share this content


