Detecting Outliers and Anomalies in Time Series Data

Peter Prevos |
465 words | 3 minutes
Share this content
Reporting all available data has little value because it overwhelms the organisation with information that is not actionable. A more productive approach to processing the data deluge is to show those processes where something interesting has occurred. A range of techniques is available to detect anomalies in the data. Reporting outliers and anomalies focuses the organisation's attention by raising questions and motivating action. This chapter of Data Science for Water Utilities discusses finding the most exciting points in your data to create actionable reports. This chapter also shows how to streamline code with functions and develop a leak detection tool to use with digital metering data. The learning objectives for this session are:
- Apply statistical methods to detect outliers
- Find anomalies in a time series
- Develop R functions to streamline your code
- Write a function to detect leaks from digital metering data

Data Science for Water Utilities
Data Science for Water Utilities published by CRC Press is an applied, practical guide that shows water professionals how to use data science to solve urban water management problems using the R language for statistical computing.
The data and code used in this chapter are available on GitHub:
Anomaly Detection Methods
Several methods are available to detect anomalies:
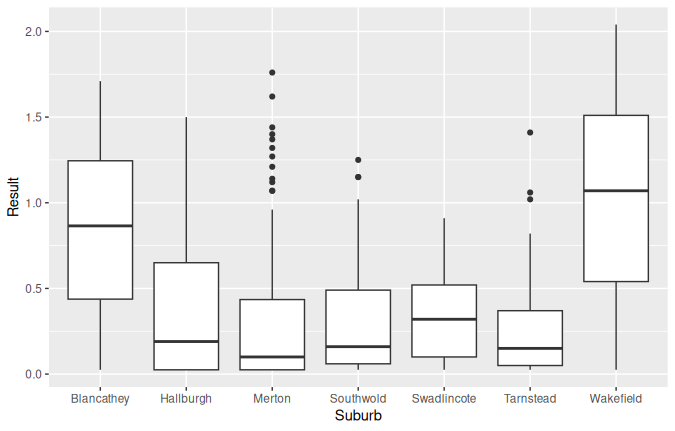
- Visual inspection of graphs (such as boxplots, see chapter 6)
- Static thresholds, such as physical constraints or a regulatory limit
- Statistical criteria (such as Z-scores and Median Absolute Deviation)
- Domain knowledge

Leak Detection
Domain knowledge also helps to detect anomalies. For example, reservoir levels cannot extend much above the Full Supply Level, and a pH probe cannot measure values of zero and so on. Domain knowledge helps to define typical situations.
Detecting leaks downstream of a meter is easy when we can make some assumptions about the consumption pattern. For any residential connection, we can safely assume there is no flow for at least a few hours daily. This assumption can easily be transformed into code.

The data for this case study was simulated using R scripts. A previous blog post about analysing digital meter data contains more details.
Detecting Outliers and Anomalies Screencast
Additional Resources
The video below provides an excellent introduction to the principles of anomaly detection.
Other Chapters
Previous Chapter: Working with Dates and Times
Next Chapter: Introduction to Machine Learning
Feel free to contact me if you have any comments, suggestions or questions about this book.
Share this content


