Clustering Customers to Define Segments

Peter Prevos |
672 words | 4 minutes
Share this content
The ideal form of customer service is personal attention, where the needs of each individual are met. Unfortunately, this level of service is more often than not impossible or too costly to achieve. Service providers, therefore, segment their customers into groups with similar characteristics. Cluster analysis to segment customers is a commonly used technique, which analyses and divides an unlabeled dataset into groups of observations with similar properties. This chapter of Data Science for Water Utilities shows how to detect patterns and define segments in customer data. The learning objectives for this chapter are:
- Understand the principles of customer segmentation
- Apply and interpret hierarchical cluster analysis
- Apply and interpret k-means clustering
Data Science for Water Utilities
Data Science for Water Utilities published by CRC Press is an applied, practical guide that shows water professionals how to use data science to solve urban water management problems using the R language for statistical computing.
The data and code used in this chapter are available on GitHub:
Principles of Customer Segmentation
The ideal situation for customer-centric services is that each customer receives individual attention. For large organisations, giving each customer individual attention is very costly and treating everybody the same is not very good either. Customer segmentation helps service providers group customers into segments with similar needs.
- Demographic: Age, gender, income, education, ethnicity.
- Behavioural: Purchasing habits, spending habits, water consumption.
- Psychographic: Interests, lifestyle, motivations, and water-related priorities.
- Geographic: Town, postal code, water system.
Hierarchical Cluster Analysis
This example contains data from ten hypothetical customers (A–J). The first data dimension in the test data is the average annual water consumption, and the second is the size of the land on which the house resides. The clusters should be easily visible by viewing the image.
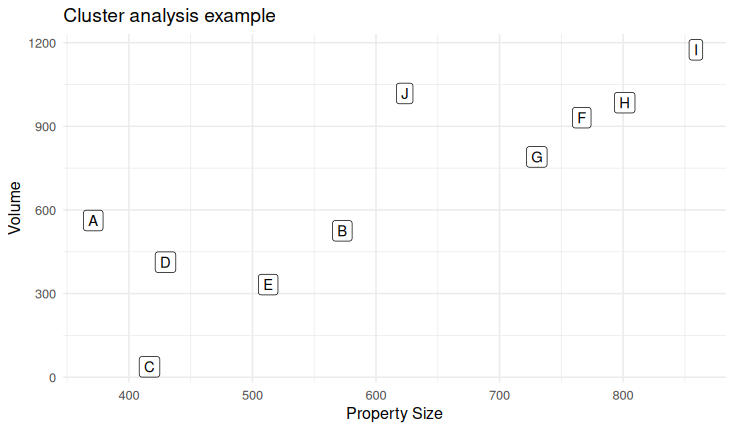
Hierarchical cluster analysis is a deterministic method to find the relevant clusters. This method reviews all possible combinations of data points and can thus be problematic when analysing large amounts of data. This tree diagram shows how all the points in the chart relate to each other.

k-means clustering
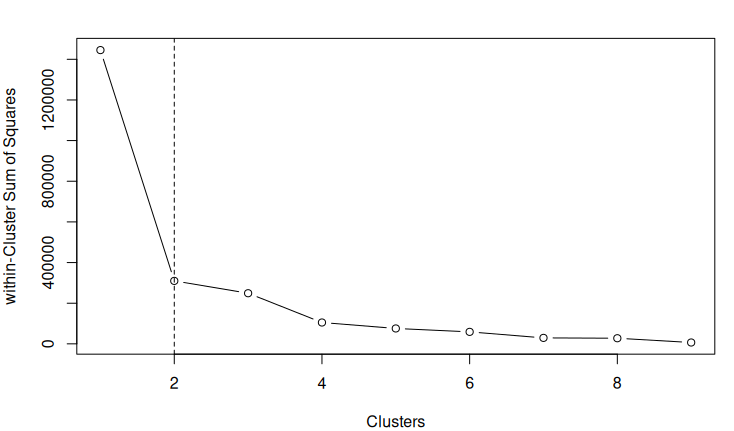
The k-means method uses a stochastic approach, which means that the outcome is not always the same when some clusters are in doubt. But, this method can digest much larger data sets than the hierarchical method. Another difference with the first method is that in k-means, you need to specify the number of clusters before the analysis starts.
The elbow method visualises the Within-Clusters Sum of Squares for the number of clusters. The location where the graph has the smallest angle is most likely the ideal number of clusters.
Interpreting cluster analysis
Clustering analysis methods are a form of unsupervised machine learning. The computer detects patterns in the data but cannot relate them to meaning. The results of a cluster analysis require human interpretation to link it to the context of the data.
In this simple example, we could name the two clusters of households with and those without a garden.
In reality, cluster analysis occurs with many more variables, as in these simplified examples. The book provides a small case study that also uses categorical data.
Cluster Analysis to Segment Customers Screencast
Chapter ten of Data Science for Water Utilities explains the principles of cluster analysis for customer segmentation in more detail. This screencast demonstrates how to undertake cluster analysis to segment customers using the code explained in the book.
The data and code used in this chapter are available on GitHub:
Additional Resources
My book Customer Experience Management for Water Utilities by IWA publishing delves deeper into using marketing theory for urban water supplies.

Customer Experience Management for Water Utilities: Marketing Urban Water Supply
Practical framework for water utilities to become more focused on their customers following Service-Dominant Logic.
Other Chapters
Previous Chapter: Basic Linear Regression
Next Chapter: Working with Dates and Times
Feel free to contact me if you have any comments, suggestions or questions about this book.
Share this content

