Basic Linear Regression

Peter Prevos |
458 words | 3 minutes
Share this content
Regression analysis is one of the most common methods to investigate relationships between variables. Understanding basic linear regression is the first step toward predictive analysis and machine learning. This chapter of Data Science for Water Utilities explores possible linear relationships between the responses in the customer survey and uses these results to explain the theory and practice of building and assessing linear models. The learning objectives for this chapter are:
- Understand the principles of linear regression
- Perform a linear regression of the customer survey data
- Assess the significance of a linear regression

Data Science for Water Utilities
Data Science for Water Utilities published by CRC Press is an applied, practical guide that shows water professionals how to use data science to solve urban water management problems using the R language for statistical computing.
The data and code used in this chapter are available on GitHub:
Principles of Linear Regression
The purpose of a regression model is to predict one variable by measuring one or more other variables through a linear relationship. For example, predict water consumption based on the forecast temperature or investigate how customer complaints relate to the pressure level.

The task of linear regression analysis is to find the line that minimises the difference between the observed values $(y)$ and the predicted values $(\hat{y})$.
Linear Regressions in R
The lm() function is the regression workhorse that provides detailed output to assess the hypothesised relationship stored in a list.
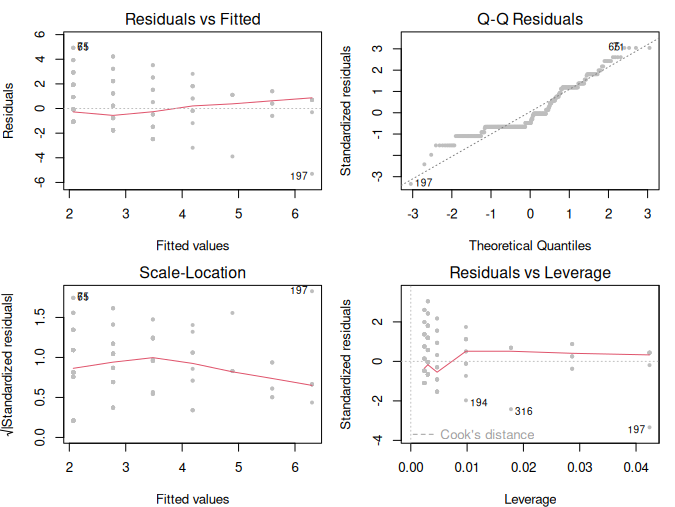
Plotting the output of the linear model provides a detailed graphical assessment of the model.
- The first plot reviews the residuals versus the fitter (predicted) values. Ideally, the red line overlaps perfectly with the x-axis.
- The QQ-Residuals Plot tests whether the distribution of the residuals is normal, which is the case when the observations are all on the diagonal line.
- The scale location plot tests for the assumption of homoscedasticity, which is the case when the red line is horizontal.
- Lastly, the leverage plot tests the data for outliers. The numbers relate to the rows with outliers. Leverage is the extent to which coefficients would change of these values are removed.

Basic Linear Regression Screencast
Chapter nine of Data Science for Water Utilities explains the theory of linear regression and how to implement it in R in more detail. This screencast runs through the code in the basic linear regression chapter.
The data and code used in this chapter are available on GitHub:
Additional Resources
Chapter 13 discusses multiple linear regression.
Other Chapters
Previos Chapter: Analysing the Customer Experience
Next Chapter: Clustering customers to define segments
Feel free to contact me if you have any comments, suggestions or questions about this book.
Share this content


